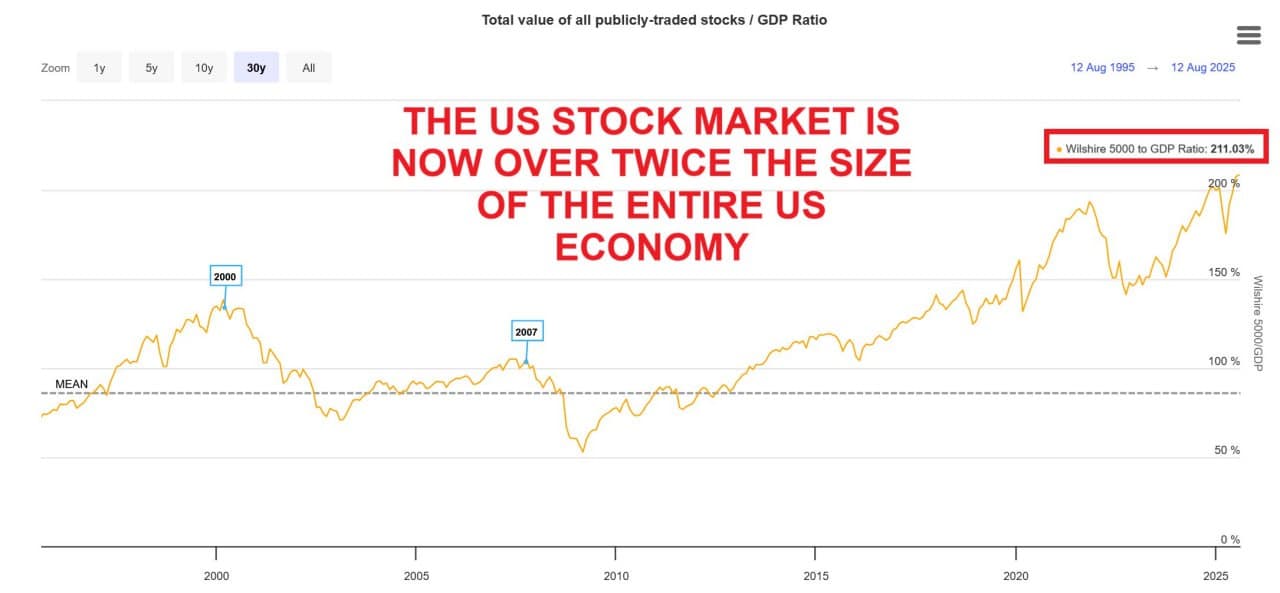
The U.S. stock market has reached a staggering milestone, with its market capitalization now exceeding 211% of the nation’s Gross Domestic Product (GDP), a record high that eclipses even the peak of the Dot-Com Bubble in 2000. This unprecedented surge has raised eyebrows among economists and investors alike, as it signals both extraordinary market performance and potential volatility ahead.
Background & Context
The stock market capitalization to GDP ratio, often referred to as the "Buffett Indicator" after billionaire investor Warren Buffett, is a widely used measure to assess whether the stock market is overvalued or undervalued relative to the economy. Traditionally, a ratio above 100% indicates that the market may be overvalued, while a ratio below that threshold suggests it may be undervalued. The current ratio of 211% marks a significant departure from historical norms, raising questions about the sustainability of this growth.
In the past three months alone, the ratio has skyrocketed by 45 percentage points, highlighting a dramatic shift in investor sentiment and market dynamics. By way of comparison, during the height of the Dot-Com Bubble, the market cap to GDP ratio peaked at approximately 144%, suggesting that the current market sentiment is not only optimistic but potentially speculative in nature.
Key Developments
This surge in the stock market can be attributed to several factors, including robust corporate earnings, continued low interest rates, and the influx of retail investors drawn in by the rise of technology stocks. Major players like NVIDIA have seen their stock prices soar, contributing significantly to the overall market cap. In a recent report, NVIDIA"s payment to the U.S. Treasury was described as "a mere drop in the bucket for national debt," indicating the scale of the tech giant"s financial influence in the current economic landscape.
Furthermore, the Federal Reserve"s monetary policies have played a crucial role in maintaining low borrowing costs, encouraging companies to invest and consumers to spend. This environment has resulted in a buoyant stock market, with investors seemingly unfazed by inflationary pressures and geopolitical uncertainties. As previously reported, the current economic climate has fostered a surge in stock prices, particularly in the technology sector, which continues to dominate the market narrative.
Broader Impact
The implications of such a high stock market cap to GDP ratio can be far-reaching. Economists warn that while a thriving stock market may signal a healthy economy, it can also lead to increased volatility and market corrections. Historical comparisons suggest that extreme ratios often precede downturns, as seen during the Dot-Com Crash and the 2008 Financial Crisis. Experts are divided on whether the current market is a bubble waiting to burst or a reflection of genuine economic growth.
Analysts are urging caution, noting that the disconnect between stock valuations and economic fundamentals could lead to significant market adjustments. The recent developments in global trade, particularly China"s manufacturing exports soaring past the U.S., Germany, and Japan combined, further complicate the landscape, as they may influence U.S. market performance and investor confidence.
What"s Next
Looking ahead, market participants are keenly watching for signs of a potential slowdown in growth or shifts in Federal Reserve policy that could impact interest rates. As the economic recovery continues, analysts will be monitoring both domestic and international indicators that could affect market stability. Investors are advised to remain vigilant and consider the historical context of the stock market cap to GDP ratio when making decisions.
In the coming months, the interplay between corporate earnings reports, inflation data, and global trade dynamics will be critical in shaping market sentiment. Stakeholders are encouraged to stay informed about recent developments in the global economy, as they may provide insight into the sustainability of this market rally.


![[Video] Gunfire between Iraqi security forces and Sadr militias in Baghdad](/_next/image?url=%2Fapi%2Fimage%2Fthumbnails%2Fthumbnail-1768343508874-4redb-thumbnail.jpg&w=3840&q=75)
